New York City Taxi Fare Prediction
 |
What is the problem?
Taxis have been making our lives easier than ever before, and it has been quite familiar for all of us to take a taxi or enjoy the service from car-hailing platforms such as Uber, Lyft and Didi, especially in big cities like New York. Yet unlike the platforms that present us with an estimated car fee before we taking the ride, we can only know the exact amount of taxi when we arrive at the destination. This awkwardness makes us curious about the prediction of it, and a precise estimation will be of great help for us to control the daily budget.
The data we use in this project is from Kaggle Playground Prediction Competition New York City Taxi Fare Prediction. The size of the train set is more than 55 million and the size of the test set is 9914. For each data in the dataset, it has several columns as predictors and a truth value of taxi fare for data in the train set. The evaluation matric we adopt is root mean-squared error (RMSE) between our prediction results and the ground truth of the testing data, and a lower RMSE value indicates that the model is better.
How do we predict the taxi fare?
We first need to do some preprocessing work before prediction. After removing some strange data, we add some other predictors, such as the distance between the pick-up and drop-off locations, and the shorter distance of pick-up or drop-off locations to the three airports in New York, on the basis of the givin predictors, and seperate the integrated timestamp into different predictors.
We try different traditional machine learning methods, including Linear Regression, Decision Tree and Random Forest in PySpark, as well as different combinations of predictors. Our experiments show that none of these models are good enough to make this prediction.
Later, we try LightGBM, which is a framework developed by Microsoft Research. The most important feature of LightGBM is that it adopts leaf-wise tree growth method instead of level-wise tree growth method. Our final model adopting LightGBM and all predictors we have gets the best RMSE value 2.96126 ever before in our project, which is a pretty decent accuracy for us.
What are the important features?
The tool SHAP is applied for interpreting this final LightGBM model. We compute the mean absolute SHAP value for each predictor in the model, which presents the importance of each predictor indirectly.
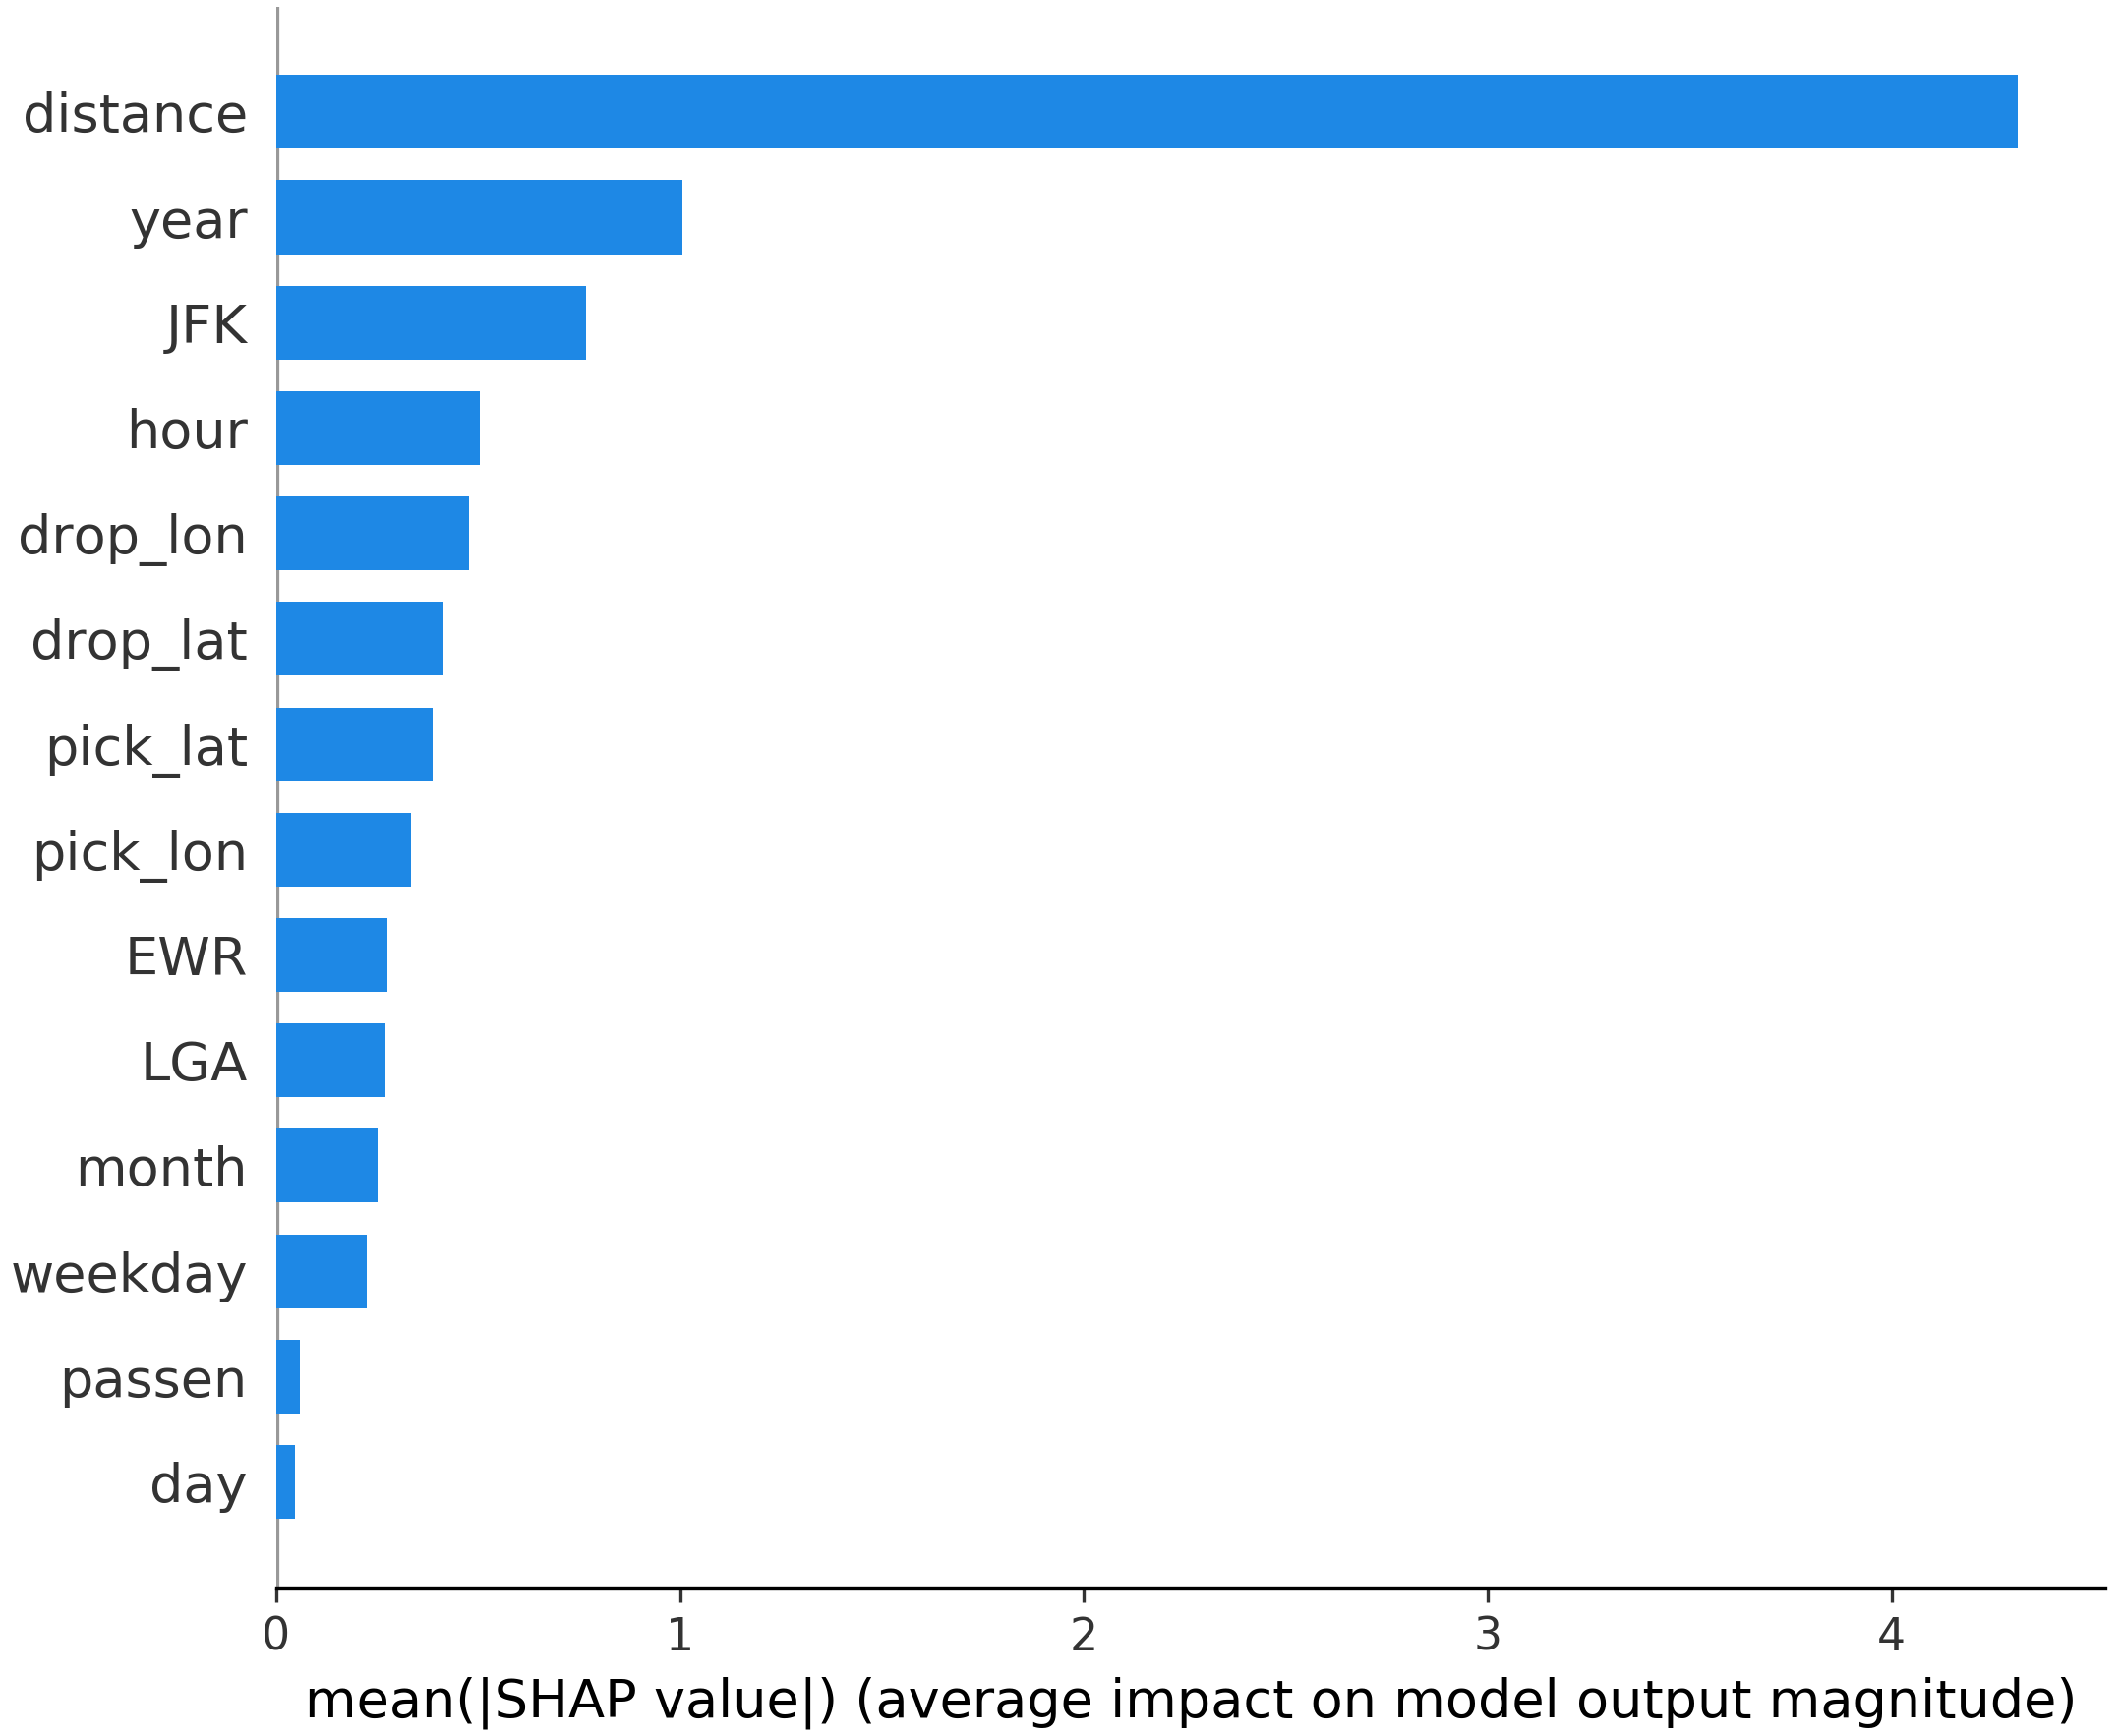 |
The top four important predictors are “distance”, “year”, “JFK” and “hour”. It is common sense that distance would be the most important predictors, and the importance of year indicates that the price per mile is rising or the road becomes more crowded these years. The distance to JFK International Airport is also important may be partly because of its flat fare rule, and it is reasonable that price is higher at night and during rush hours.
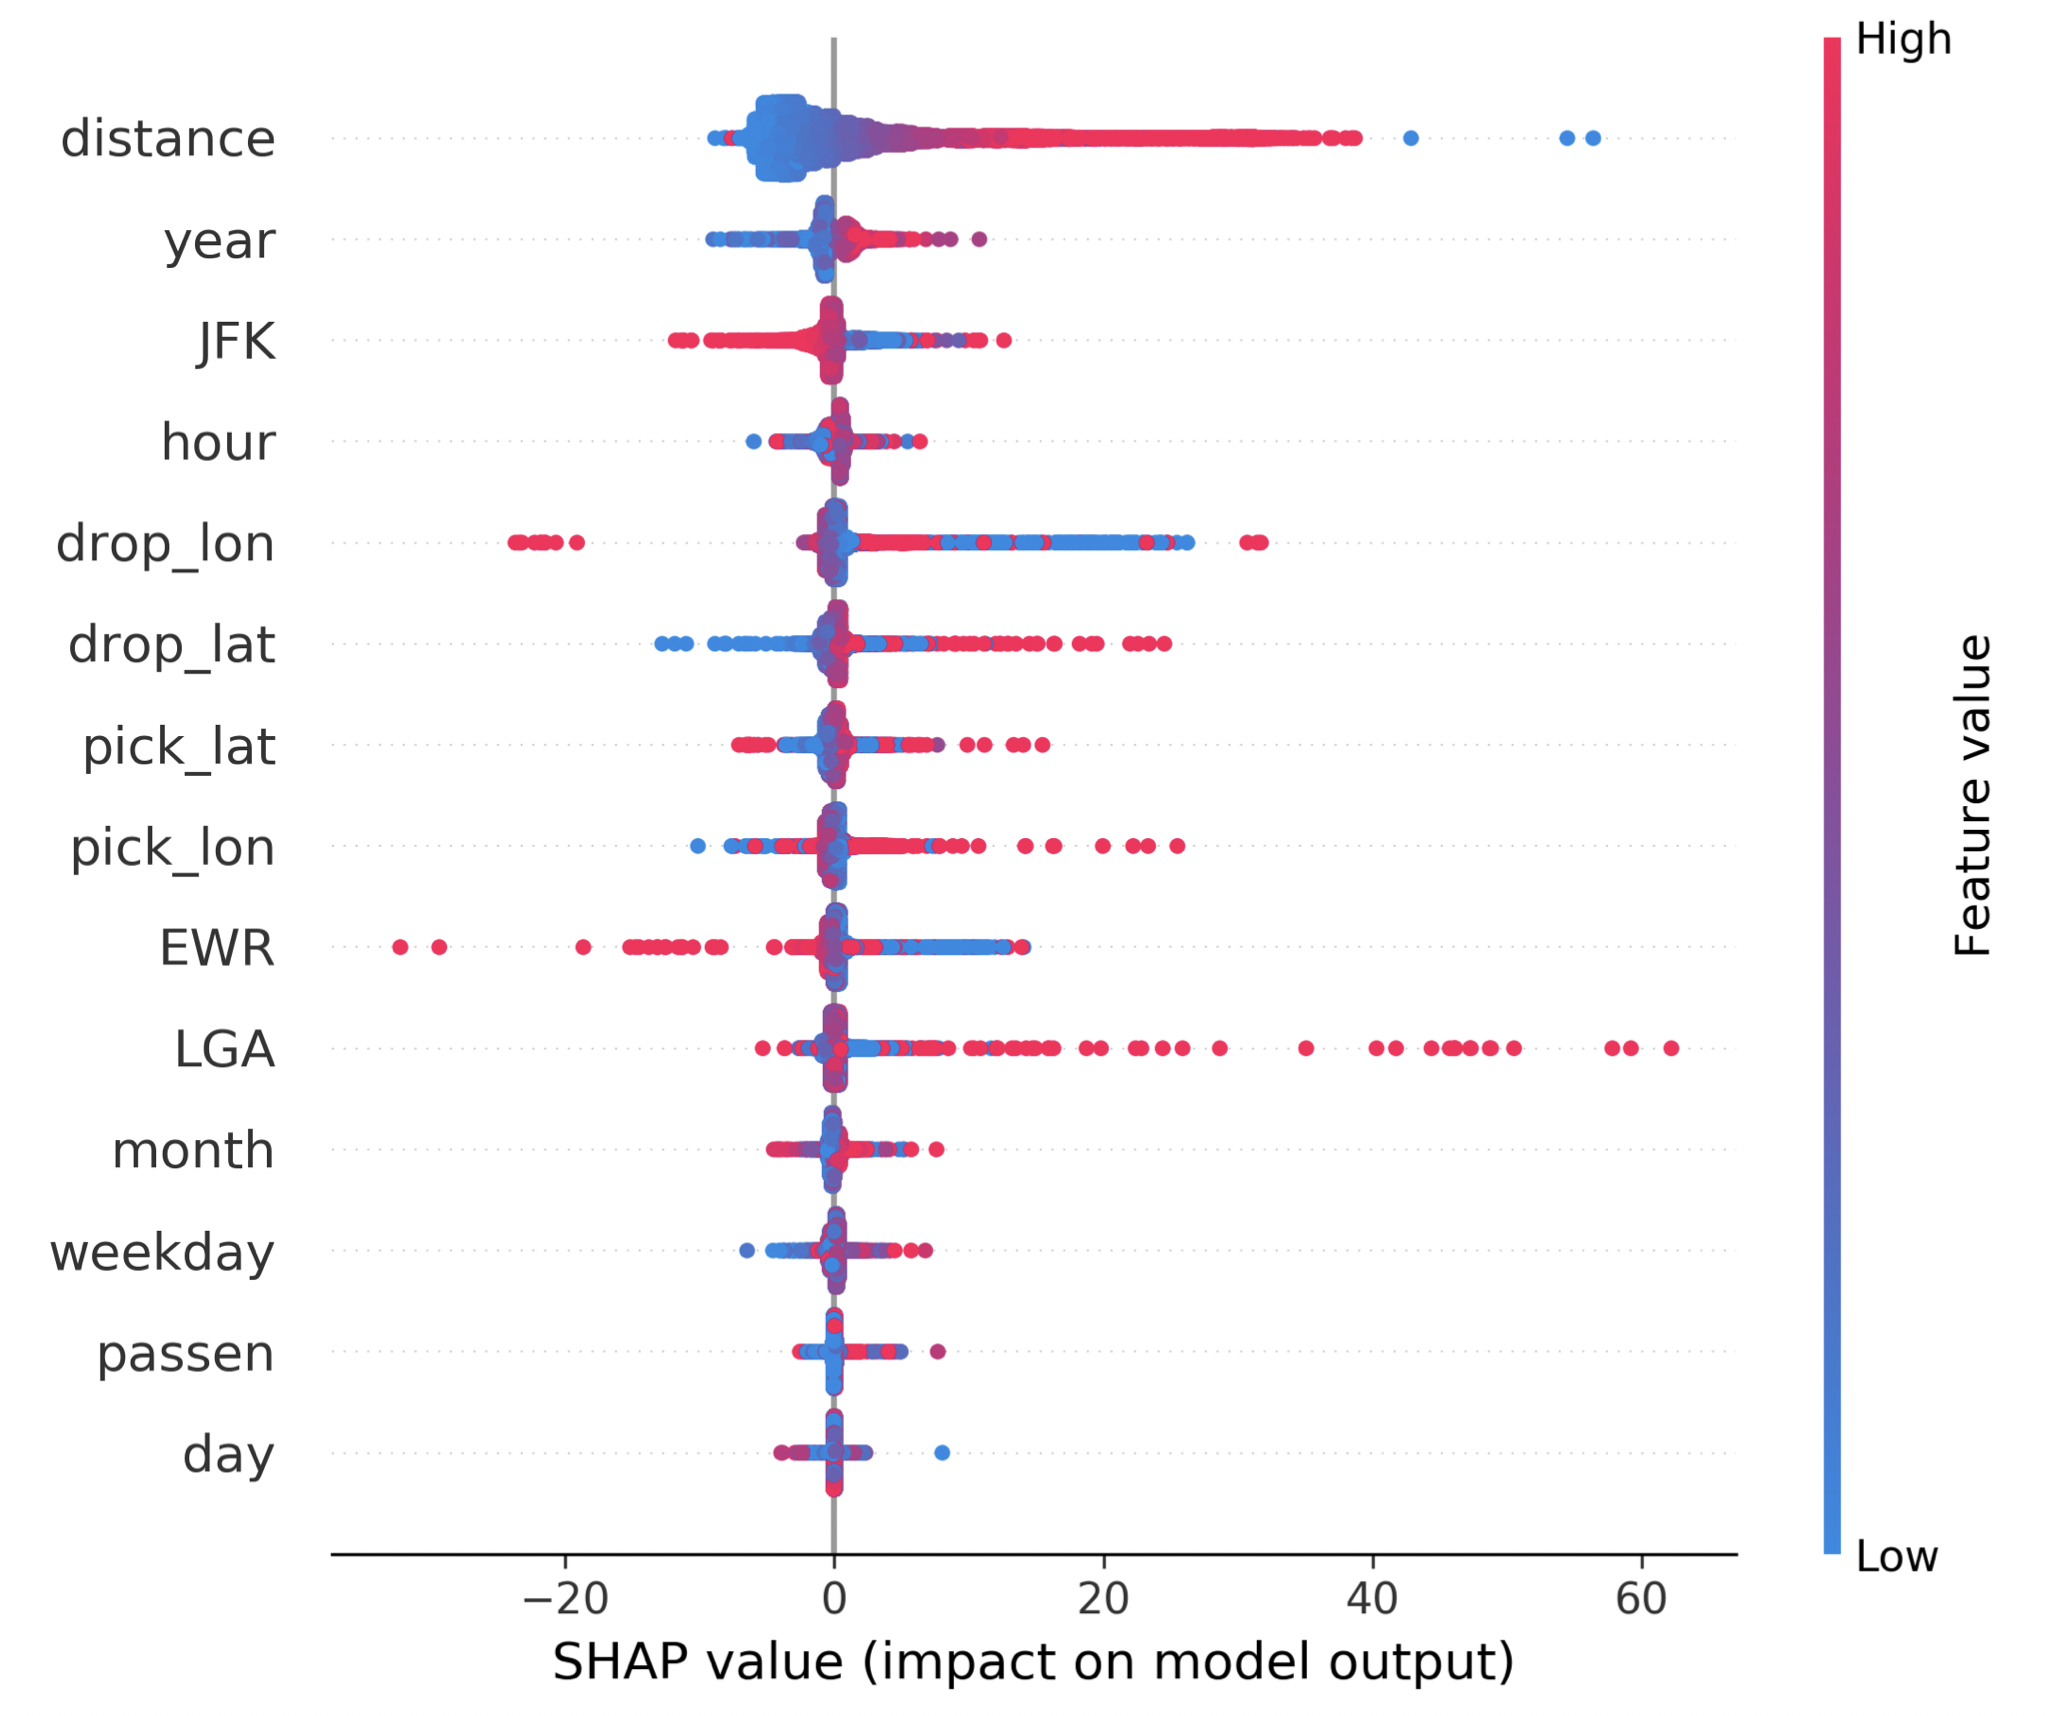
Further, we investigate how these predictors affect the prediction result in our final model. In the graph below, the x-axis indicates the SHAP value, where a predictor with a positive SHAP value means that the predictor helps to raise the predicted result, and the colors show values of the predictor.
 |
Related application
We build a demo Python application where users can input or choose the pick-up and drop-off locations to get thet predicted taxi fares.
Resources:
Open-source project on GitHub